THESEO 2000
Our campaign in winter 1999/2000 took place within the framework of THESEO 2000. Our measurements were carried out at the IRF (Swedish Institute of Space Physics) at Kiruna (67.9°N, 20.41°O, 425 m asl).
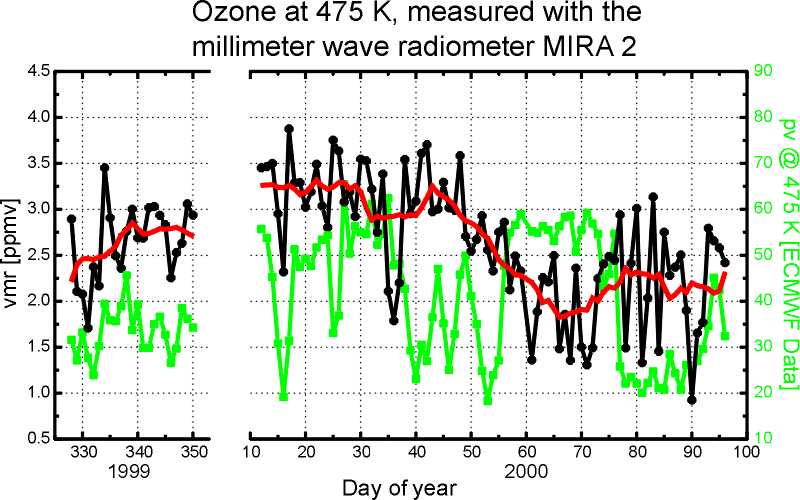
The figure beside shows the ozone volume mixing ratio at 475 K level from December 1999 to April 2000. The red curve is a 10 day's average, the green curve is the potential vorticity at 475 K over Kiruna (ECMWF data). Ozone loss from January to March 2000 due to man-made ozone depleting substances is approx. 1.2 ppmv or over 40%.
Phase 1: Vortex set up - early processing (November/December 1999)
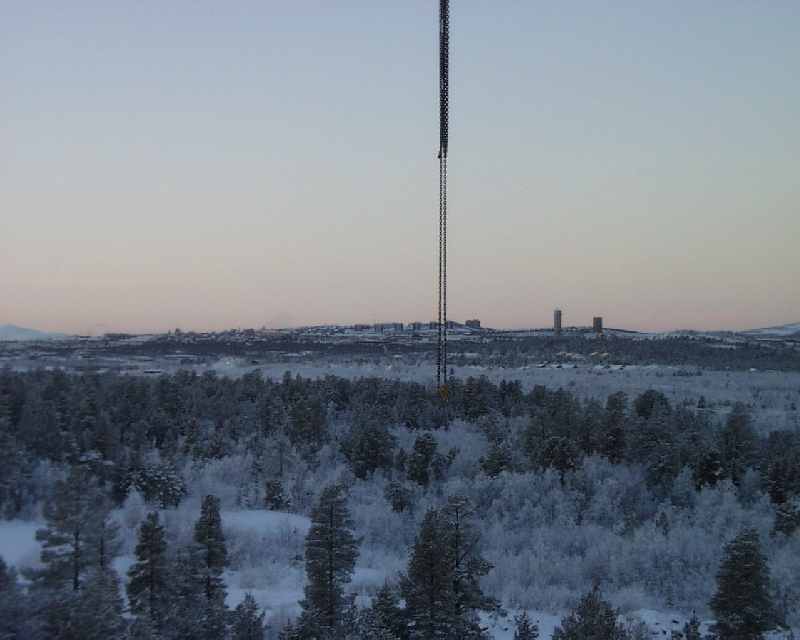
View from the roof of the IRF to Kiruna in December 1999
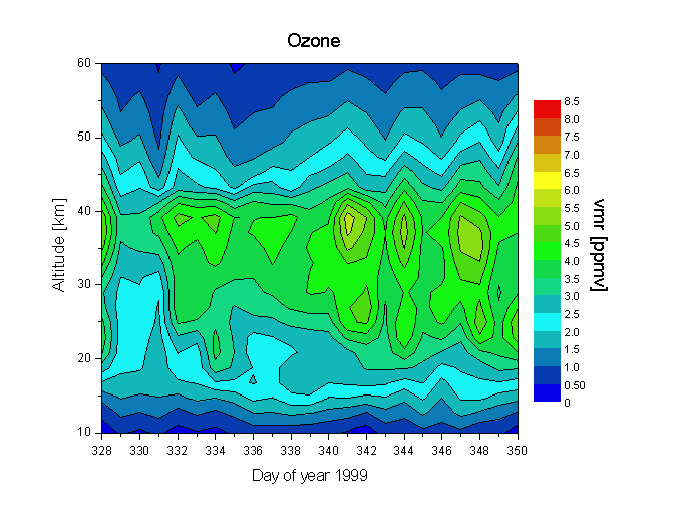
O3
|
N2O
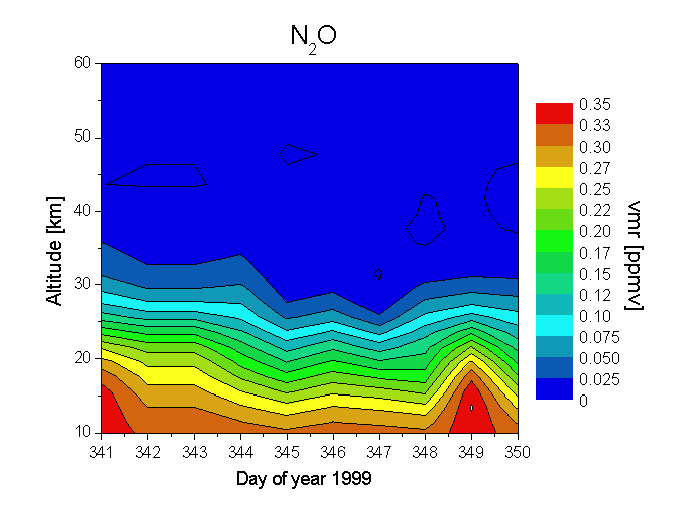
Time series of N2O-profiles measured at Kiruna in 1999
|
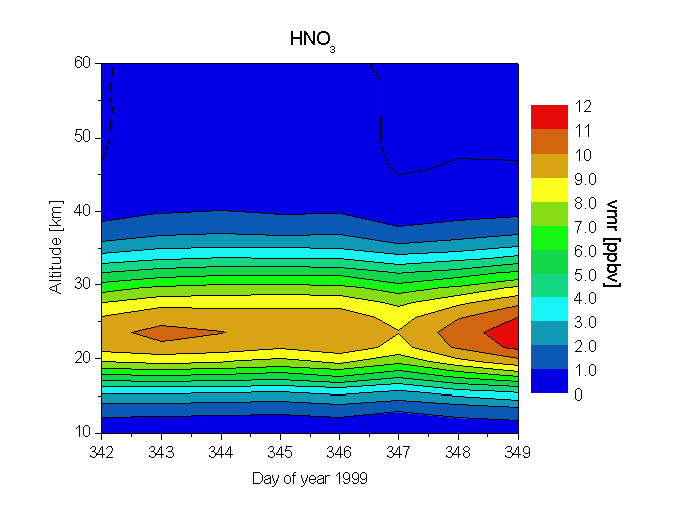
HNO3
Time series of HNO3-profiles measured at Kiruna in 1999 |
ClO
Time series of ClO-profiles measured at noon at Kiruna in 1999 |

Phase 2: Midwinter Ozone loss - PSC probe (January/February 2000)
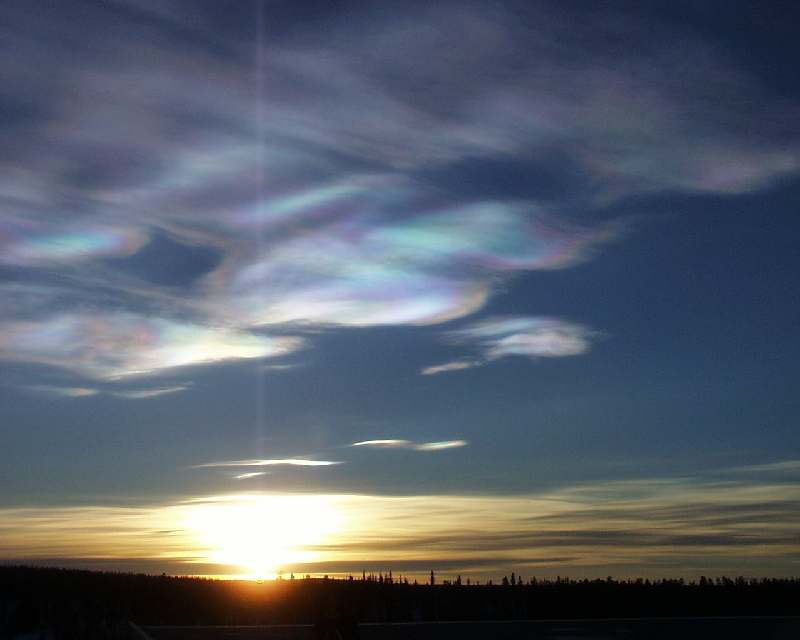
Polar stratospheric clouds (PSC) over Kiruna on 27 January 2000.
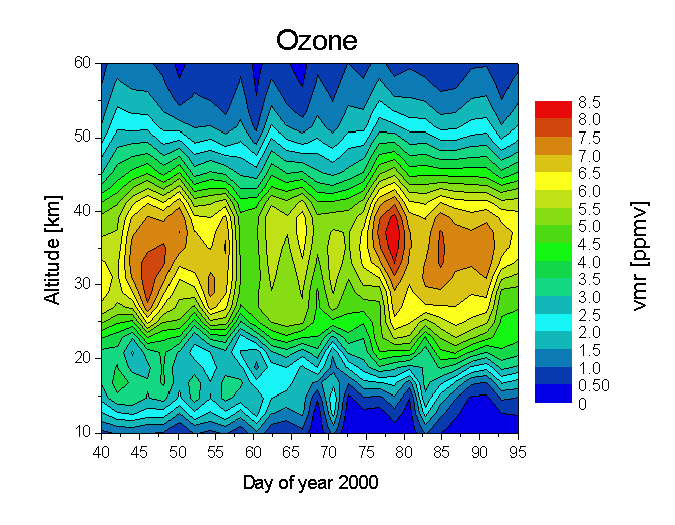
O3
Time series of Ozone-profiles measured at Kiruna in 2000 |
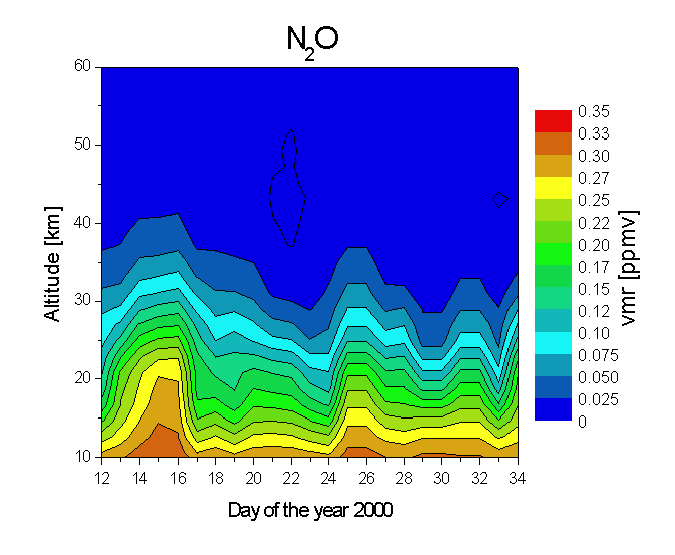
N2O
Time series of N2O-profiles measured at Kiruna in 2000 |
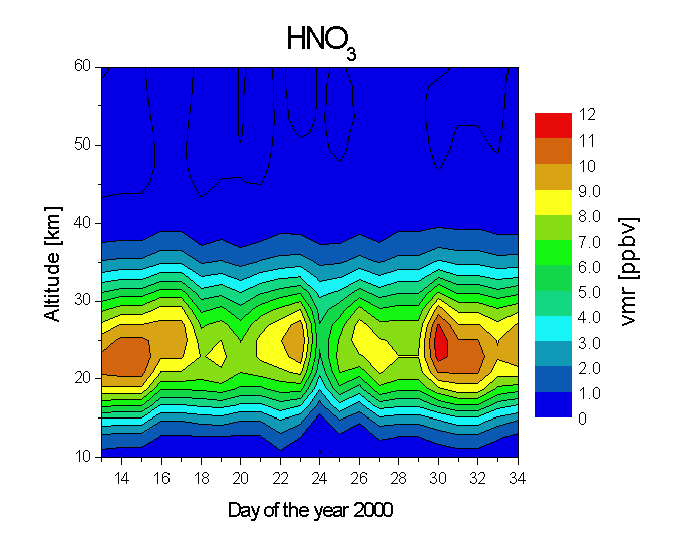
HNO3
Time series of N2O-profiles measured at Kiruna in 2000 |
ClO
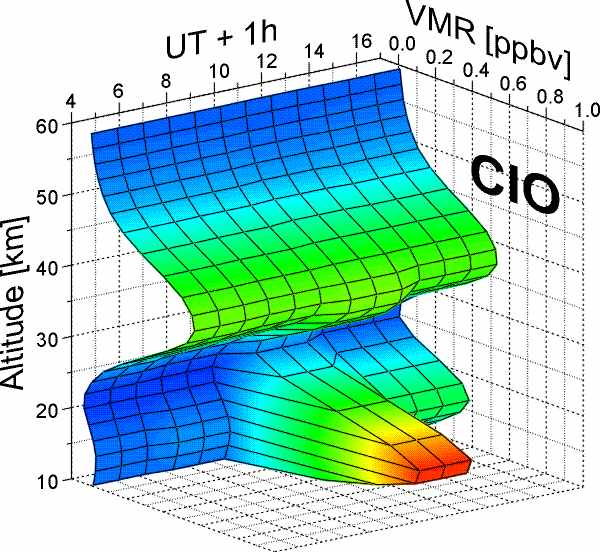
Diurnal variation of ClO over Kiruna, measured on 19 January 2000 |

Time series of ClO-profiles over Kiruna, lasting from 18 to 31 January 2000. During the grey shaded periods the system was tuned for measurements of other trace gases or there were no ClO-measurements possible due to unfavourable tropospheric conditions
Phase 3: Late winter Ozone loss, vortex breakup (February/March 2000)

View from the top of Aptasvaara in March 2000. On the left edge Arena Arctica can be seen.
O3
Time series of Ozone-profiles measured at Kiruna in 2000 |
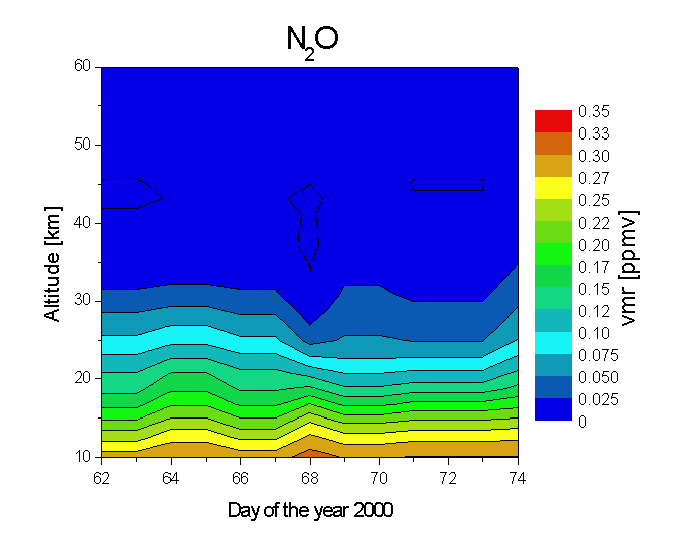
N2O
Time series of N2O-profiles measured at Kiruna in 2000 |
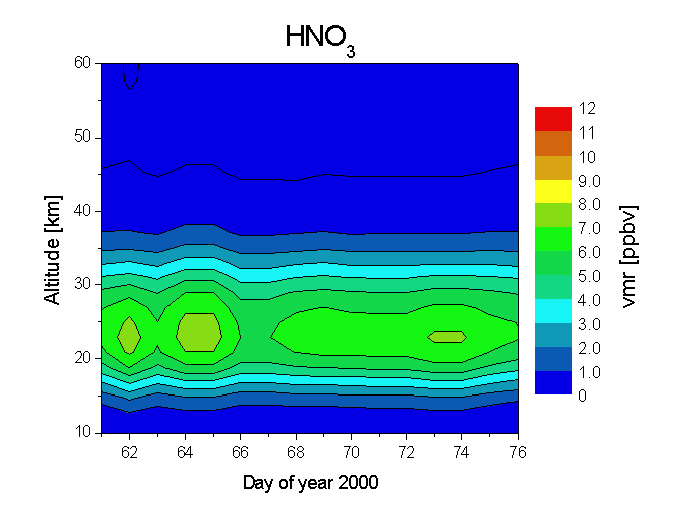
HNO3
Time series of HNO3-profiles measured at Kiruna in 2000 |
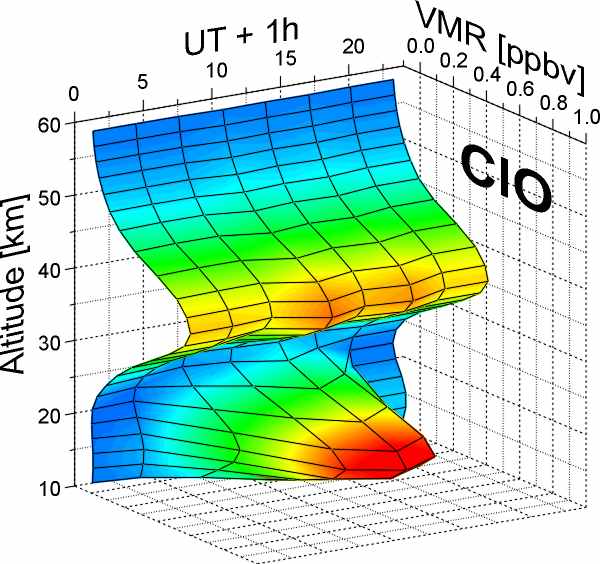
ClO
Diurnal variation of ClO over Kiruna, measured on 11 March 2000 |