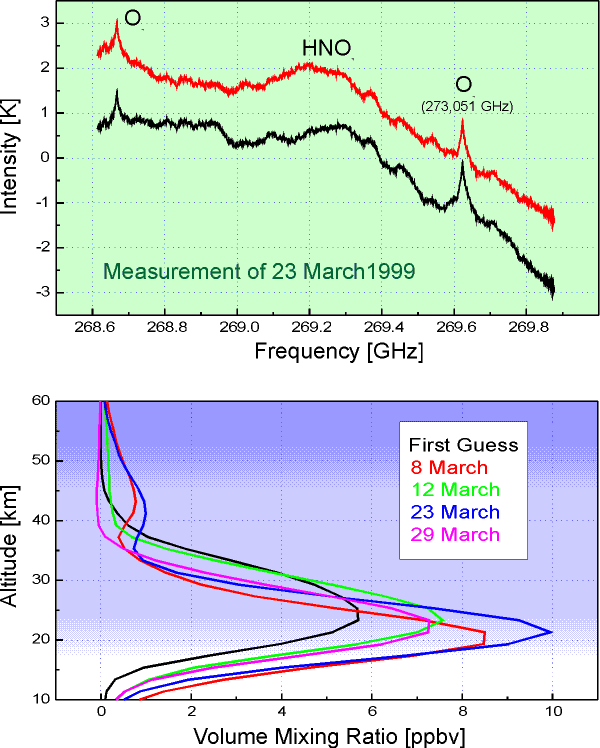
Kiruna 1999
The measurement campaign in 1999 at Kiruna (67.84°N, 20.41°E, 425 m asl), Sweden, lasted from February 22 to March 31 and spectra of the stratospheric trace gases ClO, O3 and HNO3 in the frequency range from 268 GHz to 279 GHz were measured. The inversion was performed with modified Tikhonov-Phillips-Regularization and Optimal Estimation Method. In the following a selection of spectra and inverted profiles is presented.
Periscope of the radiometer system
For the former measurement campaigns the radiometer used a periscope with adjustable elevation angle to optimize the contrast in the measured spectra. In February 1999 the radiometer system was equipped with a new periscope which enables in additional the adjustment of the azimuth angle in full 360°. Now it is possible to investigate the inhomogenities of the trace gas distribution in the different observing directions or to measure directly into PSC's.
|
|
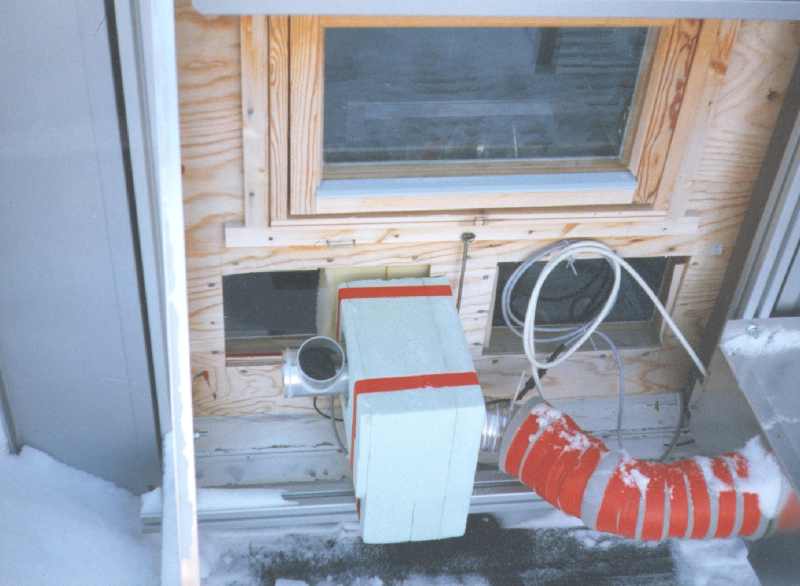
The old periscope with the tubular part on the left side which is rotatable to adjust the elevation angle The periscope is connected to the blower on the right side which prevents precipitation from invading the periscop and condensation of water vapour on the mirrors and the Brewster window. |
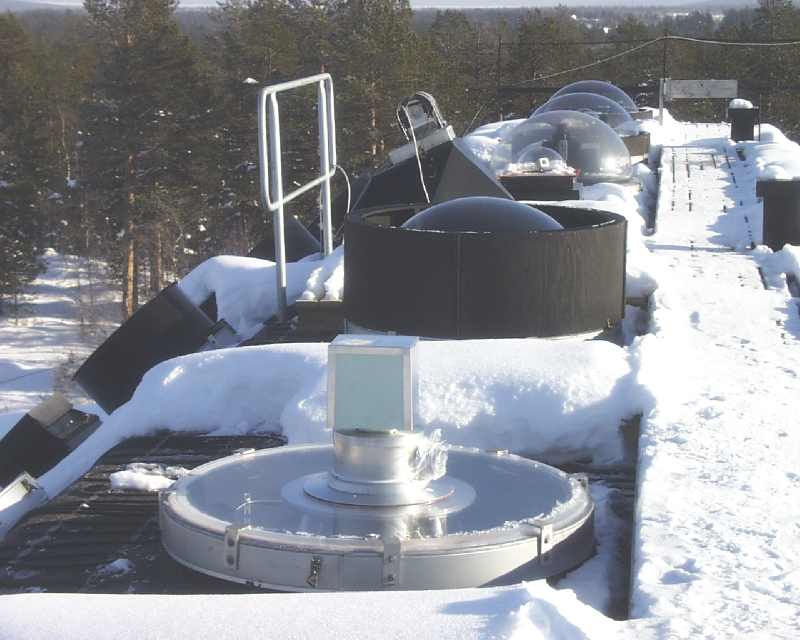 |
The roof of the IRF The metallic box in the foreground is the new MIRA periscope. The box with the cable in the background is the new solartracker of the ground-based FTIR spectrometer. |
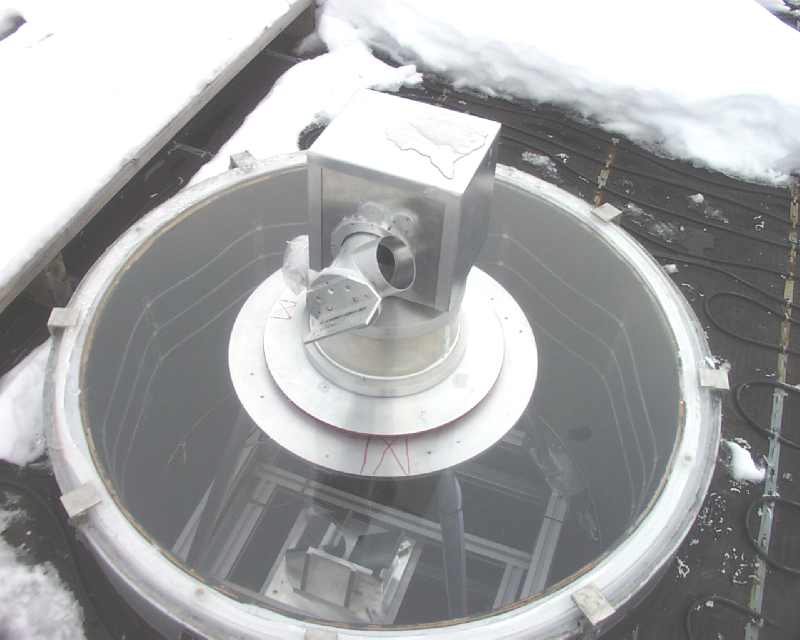 |
A more detailed view on the new periscope With the rotatable tubular part the elevation angle is adjusted whereas for the adjustment of the azimuth angle the whole box is rotated. The atmospheric radiation is guided through the axis of the box down to the two mirrors in the lower part of the picture and then down to the radiometer. |
ClO-Measurements
Due to unfavourable weather conditions during the measurement campaign in 1999 only on few days in the end of February and at the beginning of March ClO was measured. No chlorine activation could be detected which is consistent with the relative high temperatures in the lower stratosphere this winter.
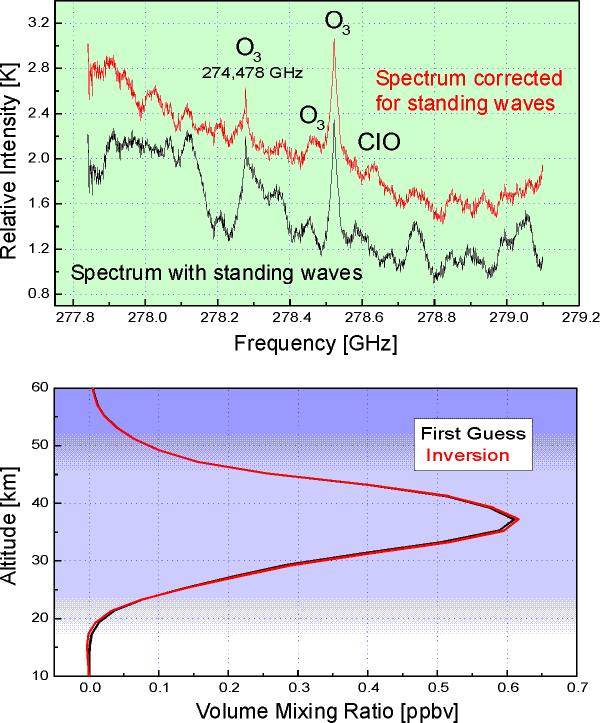 |
Upper graph: ClO spectrum measured on February 25, 1999, 8:01 - 12:02 o'clock.
|
O3-Measurements
On some days of the campaign it was not possible to retrieve vmr profiles of ozone so there are gaps in the resulting time series.
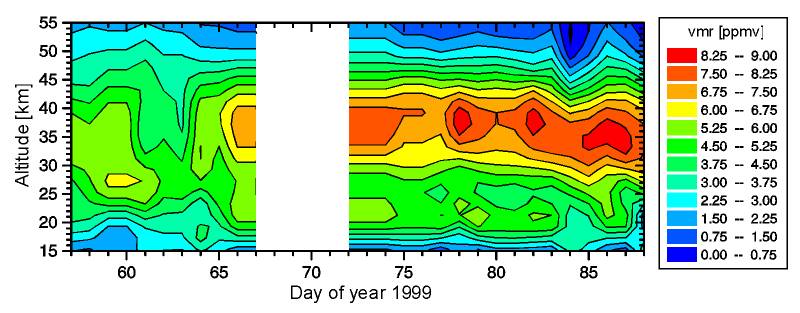 |
Ozone vmr profiles from February 26 to March 27, 1999.
|