
Kiruna 1996
Spectra of the stratospheric trace gases ClO, O3, N2O and HNO3 in the frequency range from 268 GHz to 279 GHz were measured from mid February to early April 1996 at Kiruna (67.84°N, 20.41°E, 425 m asl), Sweden. By inverting these spectra using modified Tikhonov-Phillips- Regularization and Optimal Estimation Method profiles of the volume mixing ratios of the gases could be retrieved.
In the following a selection of spectra and inverted profiles is presented. All error-bars in the profiles refer to errors caused by thermal noise.
Description of the system used
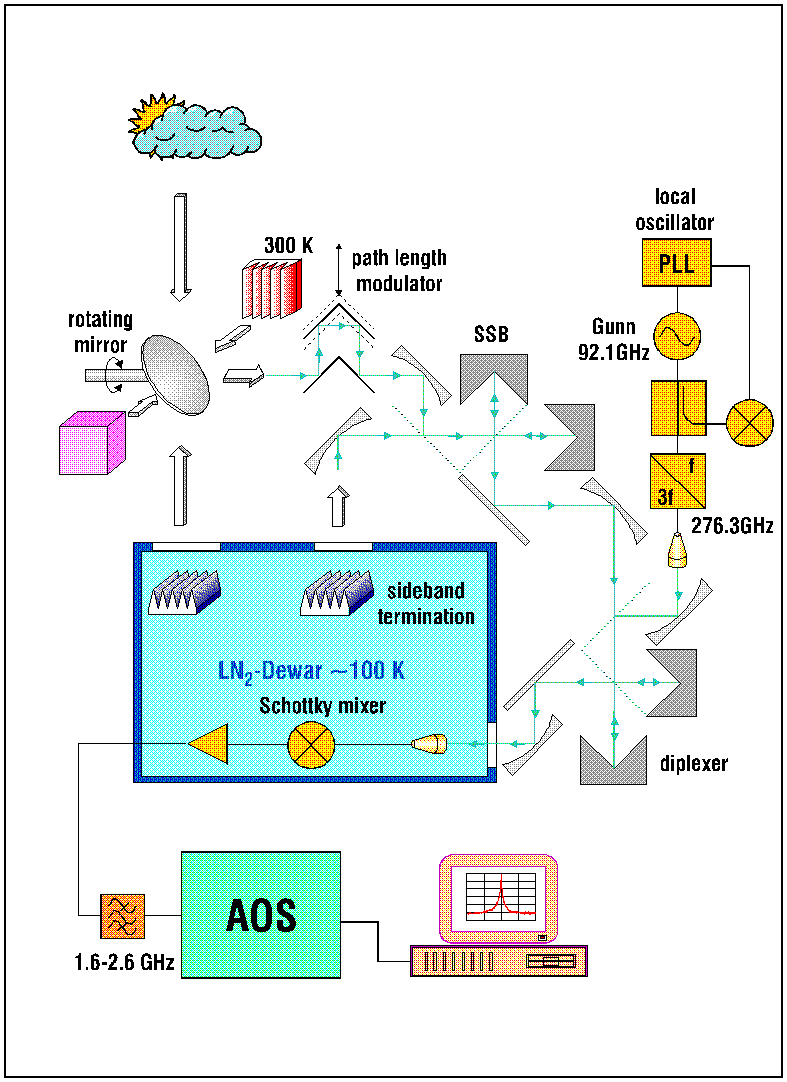
The quasioptical frontend uses a Martin-Puplett interferometer to suppress noise and atmospheric signatures from the unused sideband and a second Martin-Puplett interferometer as diplexer to feed the local oscillator (LO) to the mixer. The LO operating at 276.3 GHz uses a Gunn oscillator at 92.1 GHz and a tripler. For high frequency stability a phaselock system is applied. The downconversion to the intermediate frequency of 2.1 ± 0.5 GHz is performed by a cryogenic single-ended Schottky mixer operating at about 100K. The LN2 dewar also encloses the low noise IF amplifier and two cold loads. The systems noise temperature including quasioptics and the low-noise cryogenic amplifier is 1200 K at center frequency. Baseline ripples caused by standing waves in the quasioptical transmission path are suppressed by a rooftop-like mirror reciprocating by about 0.4 mm. The high spectral resolution of 1 MHz over an instantaneous IF bandwith of 1 GHz is achieved by an acusto-optical spectrometer.
ClO-Measurements
ClO shows a small group of lines at 278.631 GHz with a brightness temperature of about 0.1 K. The signature is superimposed by a neighbouring ozone line at 278.522 GHz. The following figures show daytime and nighttime spectra, measured on March 1 - 2 and the resulting profiles. The diurnal variation of the volume mixing ratio of ClO at an altitude of 20 km is obvious.
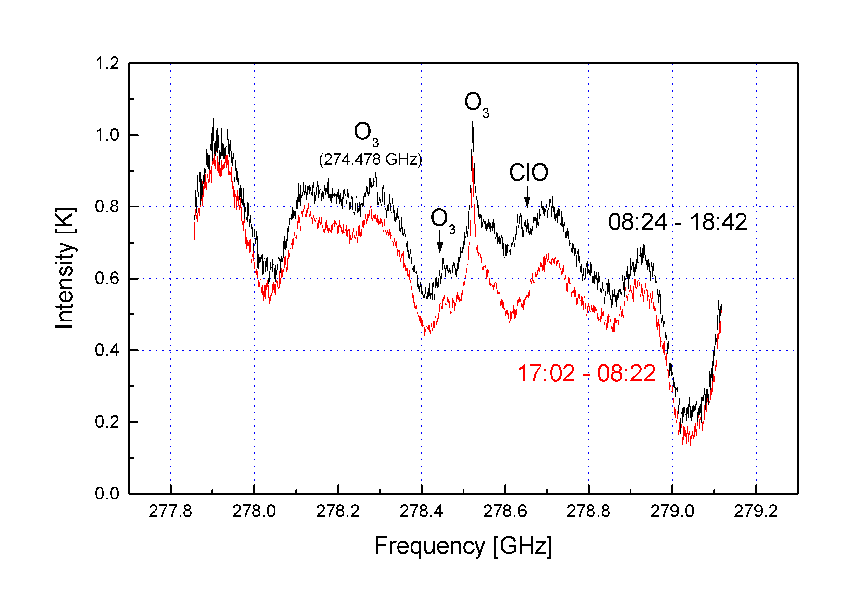 |
Raw spectra of daytime and nighttime ClO-measurements.
The spectra are disturbed by standing waves resulting from multiple reflexions in the radiometer. |
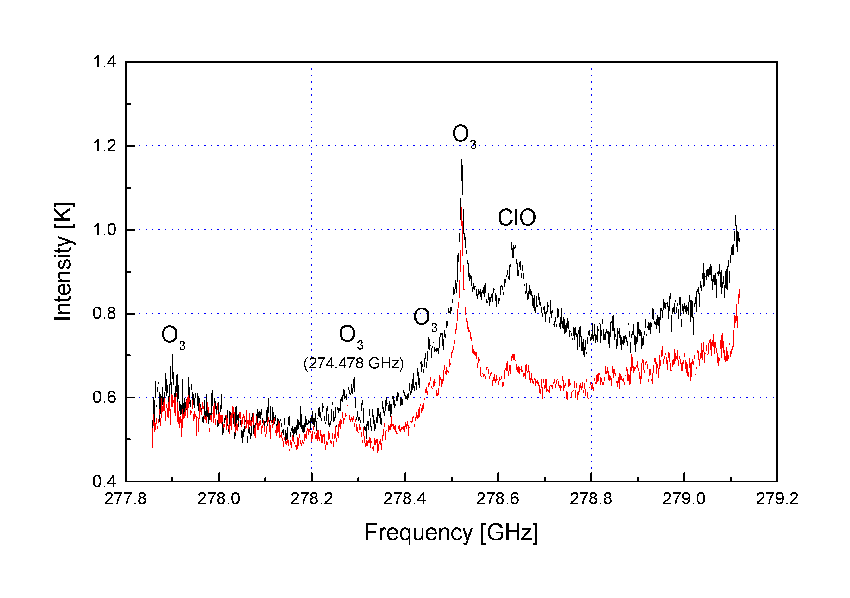 |
The same spectra, but corrected for standing waves.
The correction procedure was included in the inversion process. |
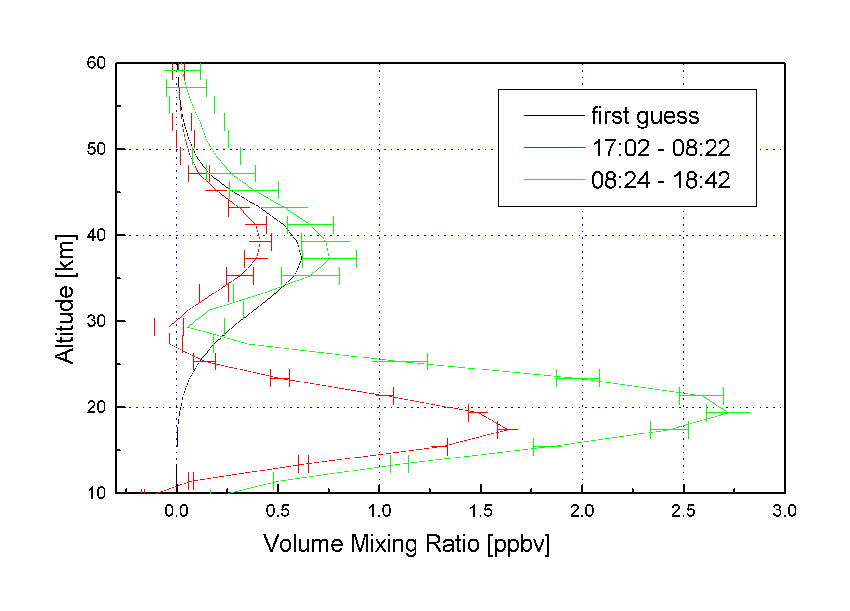 |
The inverted profiles of the ClO volume mixing ratios.
The high concentrations in the lower part of the nighttime profile are a result of the long observation period extending after sunrise. |
O3-Measurements
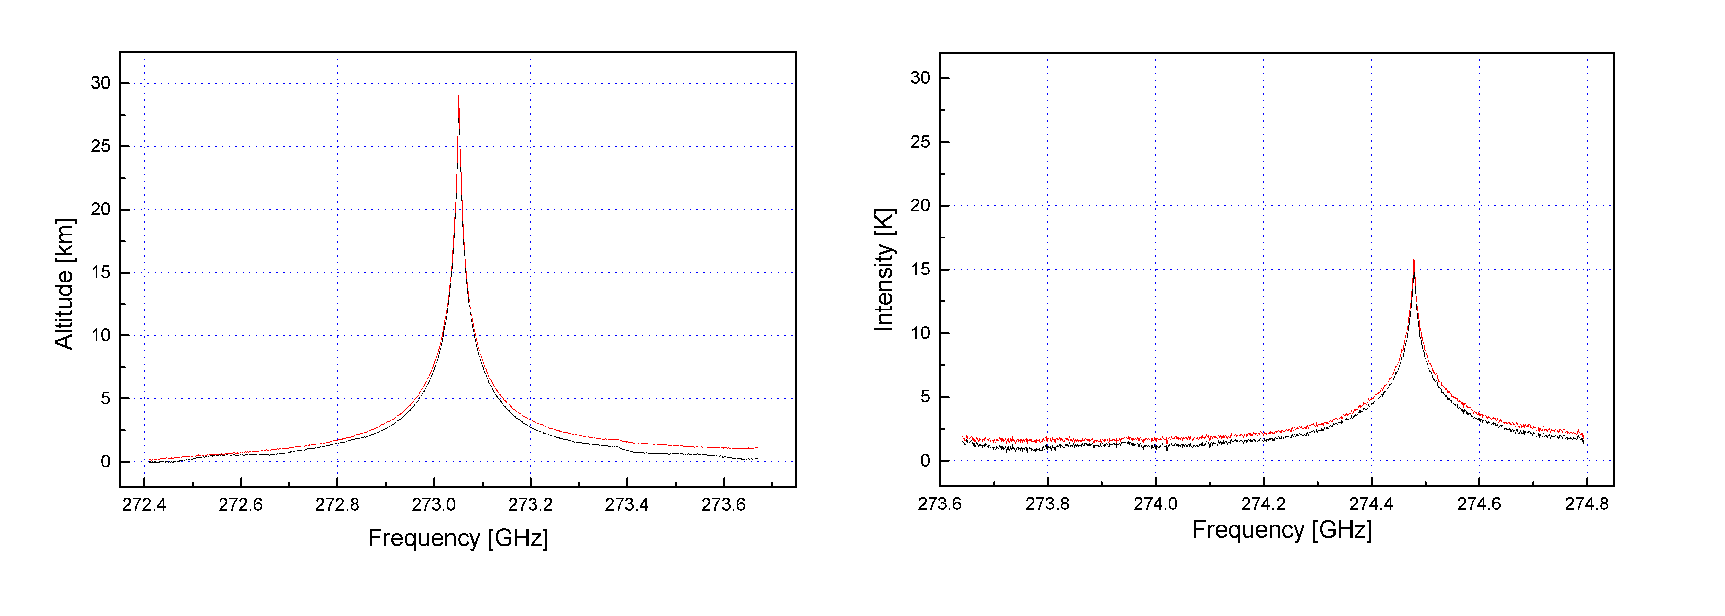
The ozone lines at 273.051 GHz and 274.478 GHz are the strongest in the frequency range covered by the radiometer. Due to the good signal to noise ratio of the measured spectra a high resolution in the profiles has been achieved.
|
|
The 273.051 GHz ozone line, measured on March 29 (left) and the 274.478 GHz line, measured on February 19 (right). The red spectra are corrected for standing waves. |
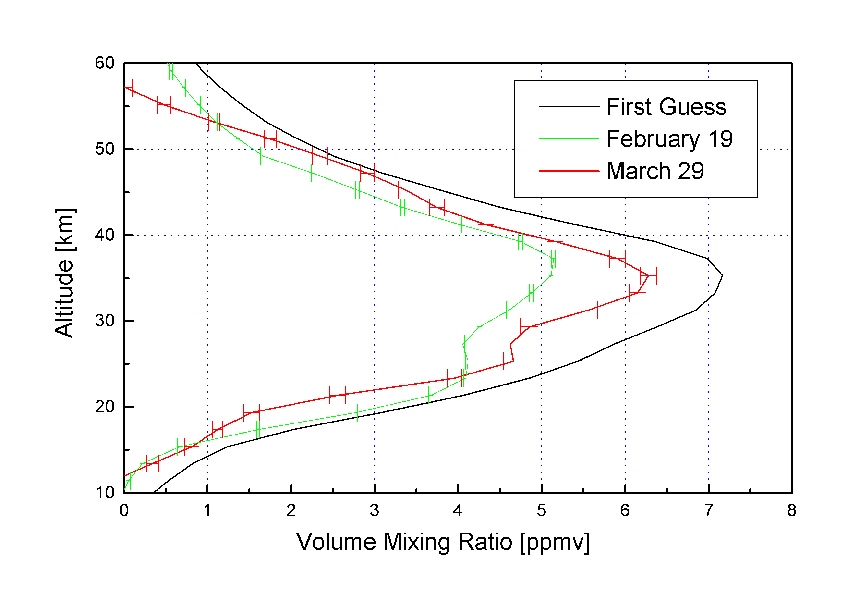 |
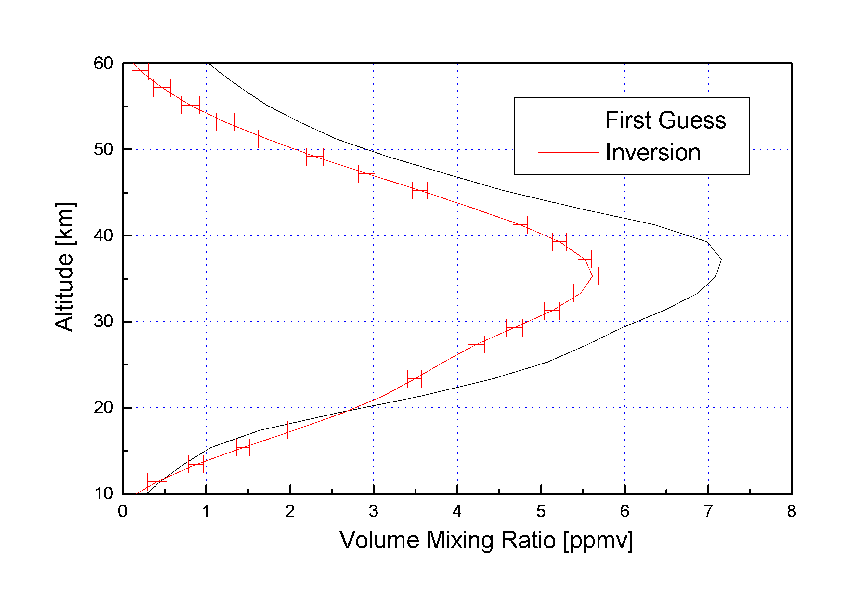
Resulting profiles of the volume mixing ratio.
|
N2O-Measurements
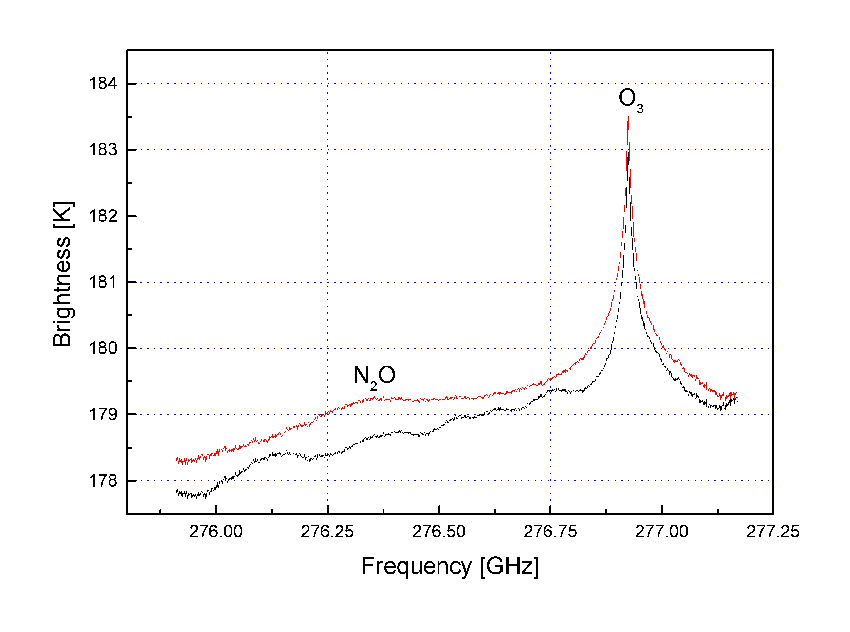
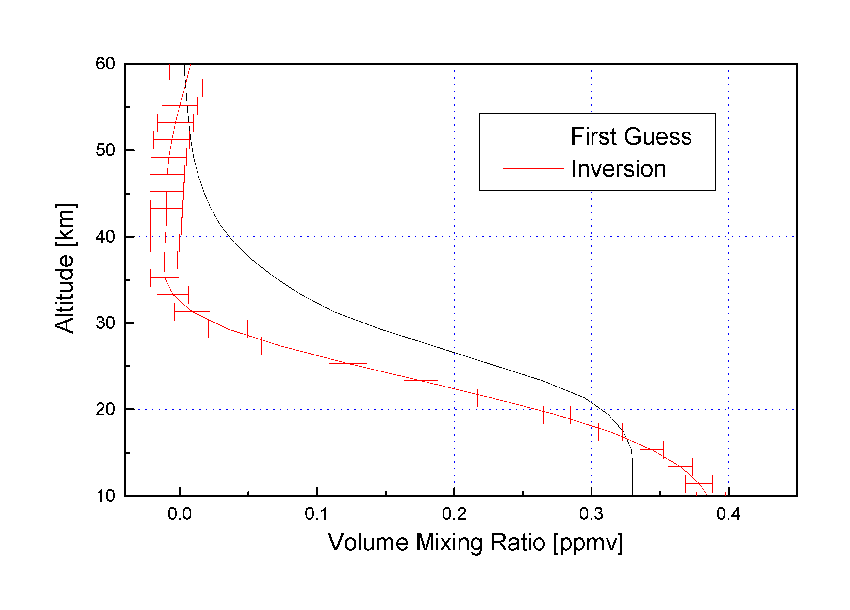
The N2O line at 276.328 GHz is difficult to detect because the maximum of the volume mixing ratio of N2O is below 20 km. This results in a weak heavily pressure broadened signature. In the raw spectra such extremly broadened lines can hardly be distinguished from the sinusoidal undulations caused by standing waves. Only in the corrected spectrum the signature of N2O is discernible.
 |
|
 |
|
 |
|
HNO3-Measurements
Caused by the pressure broadening the numerous HNO3 lines at about 269.4 GHz merge to a single wide signature.
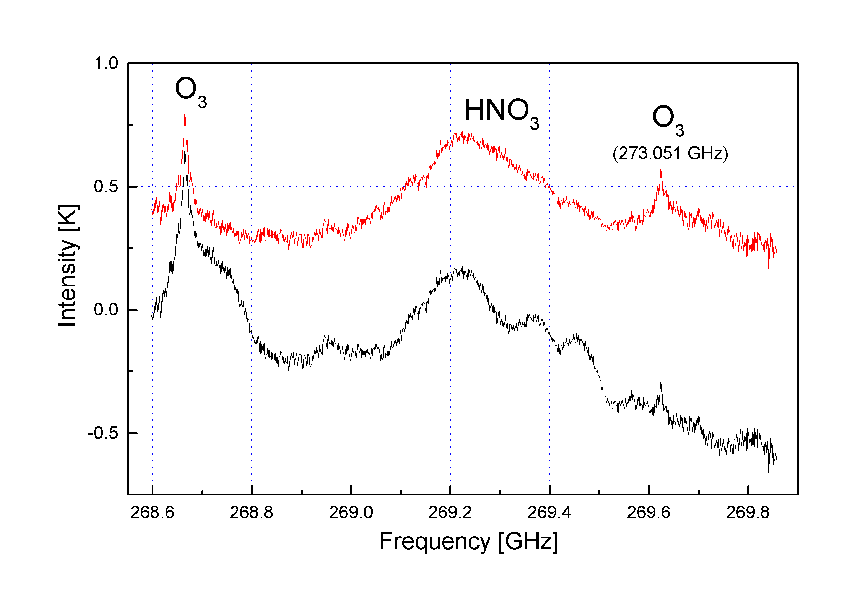 |
Measured spectrum of HNO3 and ozone from March 20. In contrast to ozone the HNO3 lines are indiscernible due to pressure broadening and overlap.
|
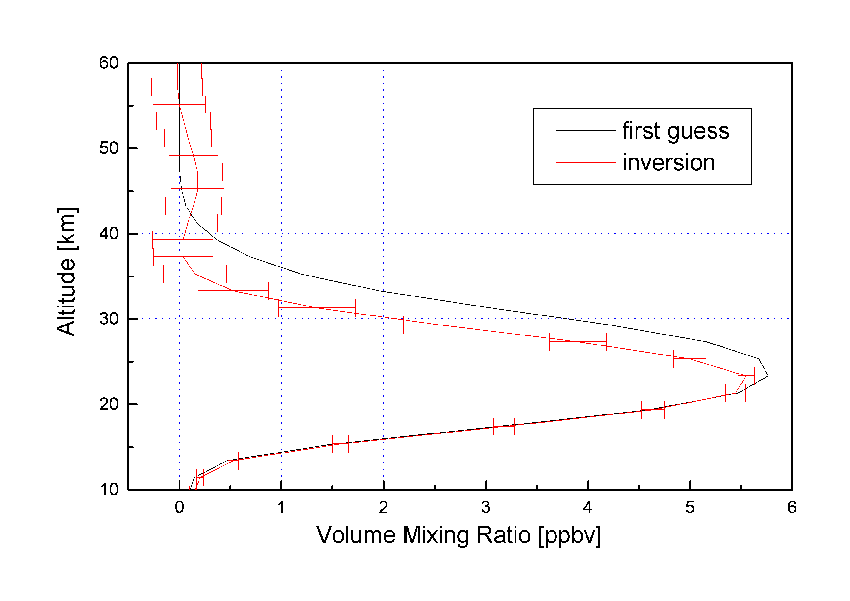 |
Retrieved HNO3 profile. The volume mixing ratio reaches its maximum at lower altitudes in comparison to the standard profile (first guess).
|
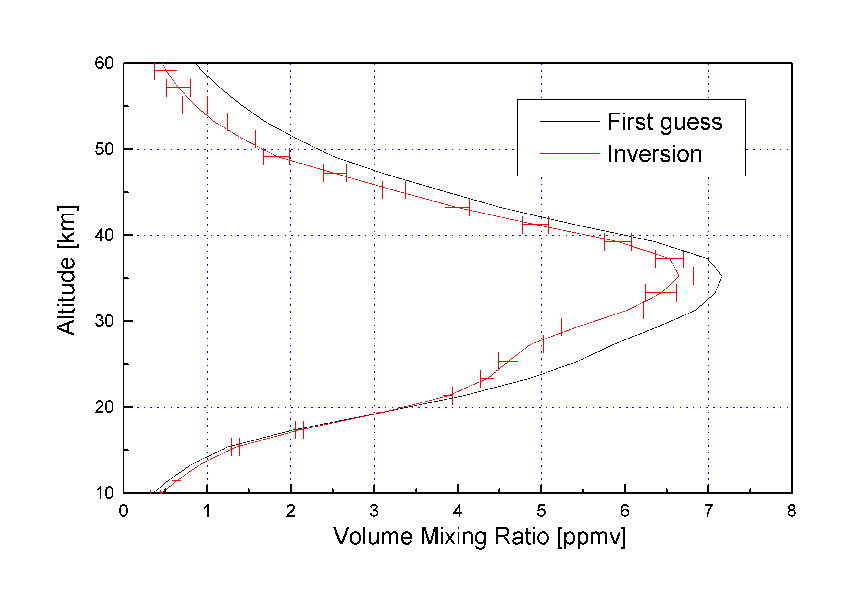 |
Ozone profile retrieved from the same measurement (for more information about the joint retrieval see Kuntz et al.).
|