
Kiruna 1998
The measurement campaign at Kiruna (67.84°N, 20.41°E, 425 m asl), Sweden, in 1998 lasted from January 26 to April 03 and spectra of the stratospheric trace gases ClO, O3 and N2O in the frequency range from 268 GHz to 279 GHz were measured. The inversion was performed with modified Tikhonov-Phillips-Regularization and Optimal Estimation Method. In the following a selection of spectra and inverted profiles is presented.
Hardware Description
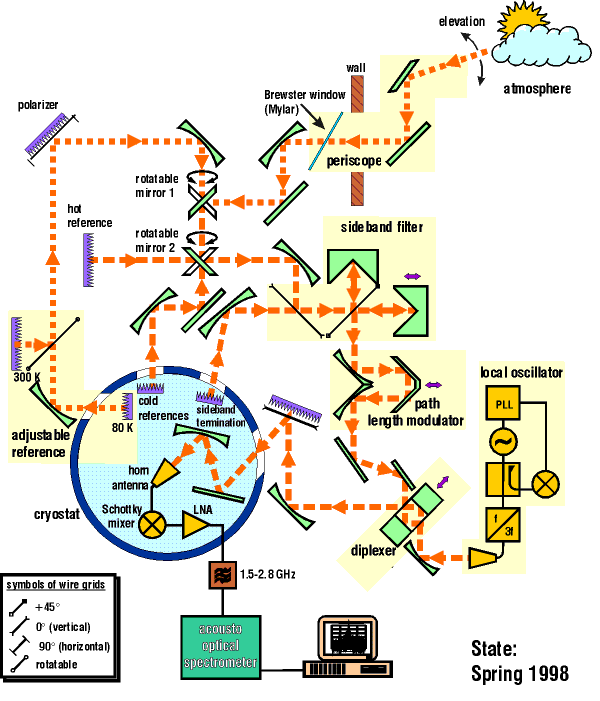
The quasioptical frontend uses a Martin-Puplett interferometer to suppress noise and atmospheric signatures from the unused sideband and a Fabry-Pérot interferometer as diplexer to feed the local oscillator (LO) to the mixer. The LO operating at 276.3 GHz uses a Gunn oscillator at 92.1 GHz and a tripler.
For high frequency stability a phaselock system is applied. The downconversion to the intermediate frequency of 2.1 ± 0.5 GHz is performed by a cryogenic single-ended Schottky mixer operating at about 100K. The LN2 dewar also encloses the low noise IF amplifier and two cold loads. The systems noise temperature including quasioptics and the low-noise cryogenic amplifier is 800K at center frequency.
Baseline ripples caused by standing waves in the quasioptical transmission path are suppressed by a rooftop-like mirror reciprocating by about 0.4 mm. The high spectral resolution of 1 MHz over an instantaneous IF bandwith of 1 GHz is achieved by an acusto-optical spectrometer.
A schematic overview of the concept is visualized in the figure beside.
ClO-Measurements
From January 28 to February 2, 1998 continuous monitoring of ClO over Kiruna was possible due to favourable weather conditions resulting in a timeseries of ClO vmr profiles covering this whole timespan.
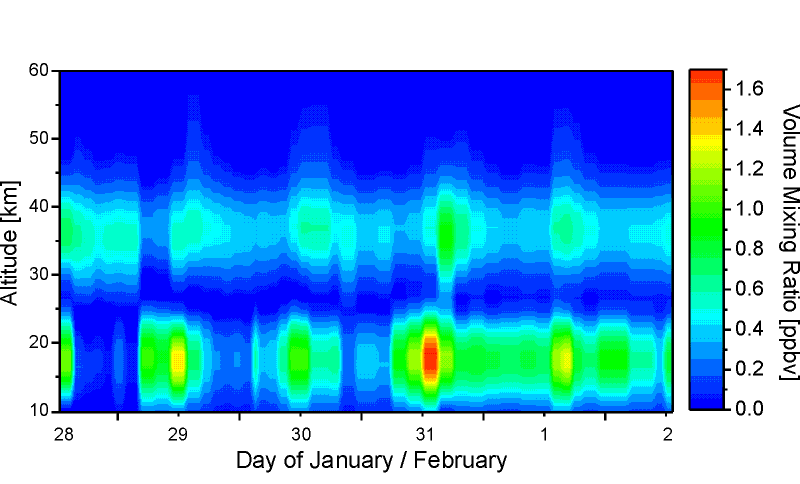 |
Time series of ClO over Kiruna lasting from January 28 to February 2, 1998
|
O3-Measurements
A complete time series of ozone vmr profiles for the whole duration of the campaign in 1998 could be retrieved. The series is composed from measurements at the strong ozone lines at 273.051 GHz and 274.478 GHz, if available. Else the results of the joint retrieval of N2O or ClO were used.
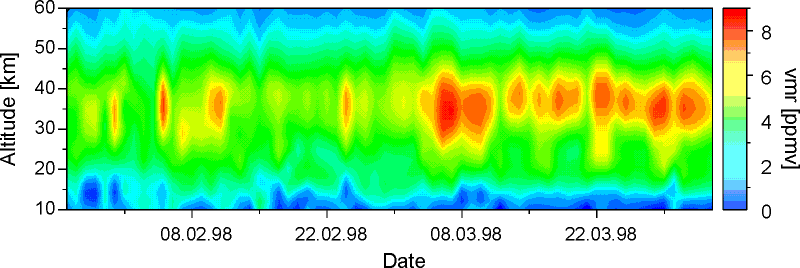 |
Ozone vmr profiles from January 26 to April 3, 1998
|
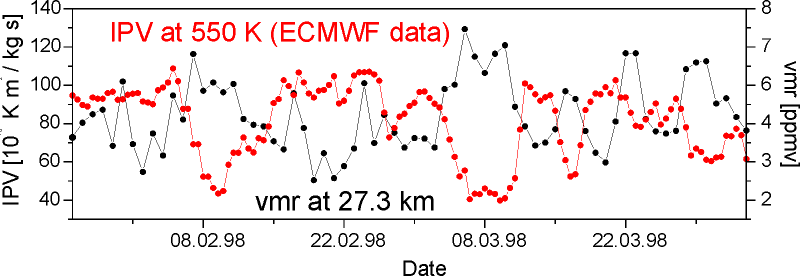 |
Comparison of the vmr values at 27.3 km and the potential vorticity at 550 K. |
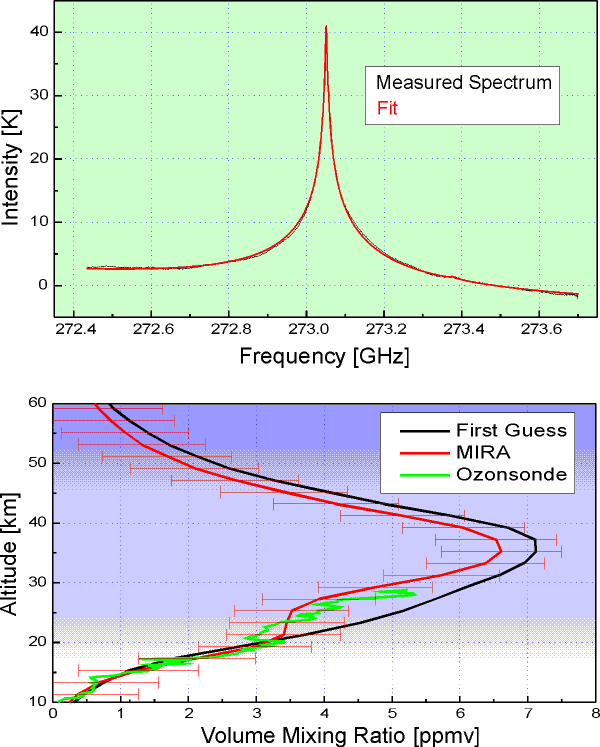 |
On March 27, 1998 there was an ozonsonde launch at ESRANGE, Kiruna.
|
N2O-Measurements
At the measurement campaign 1998 N2O measurements inside and outside the polar vortex were performed. Both in the spectra and in the retrieved vmr profiles the sinking of N2O inside the polar vortex is visible.
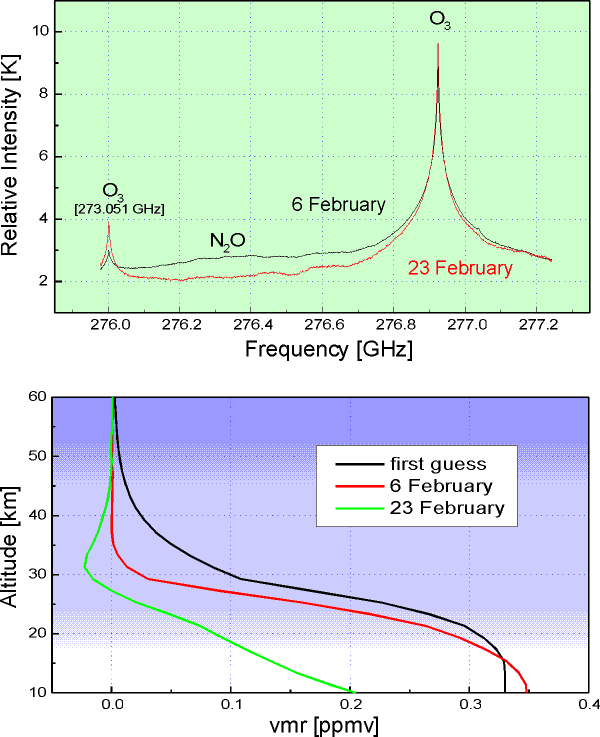 |
N2O measurements outside (February 6) and inside (February 23) the polar vortex. Upper graph: the measured spectra Lower graph: the retrieved profiles The sinking airmasses inside the polar vortex lead to a sinking of N2O. |